

Launch
The Molecular Breeding Design Tool (MBDT) is a standalone application that can be launched from the left hand Workbench menu.
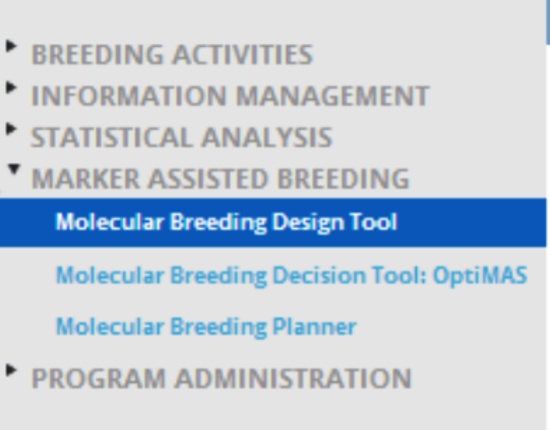
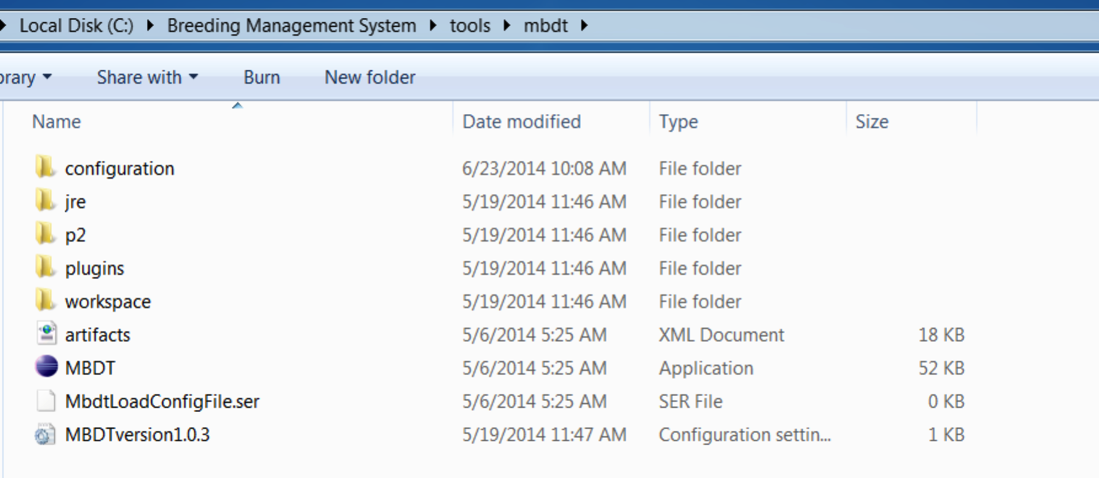
Alternatively, the Molecular Breeding Design Tool can be launched independently of the Workbench by accessing the application within the Tools folder.
C:Breeding Management SystemToolsMBDT
?
Navigating the Workbench
The application opens with the MBDT workbench, where you can create and manage your projects.
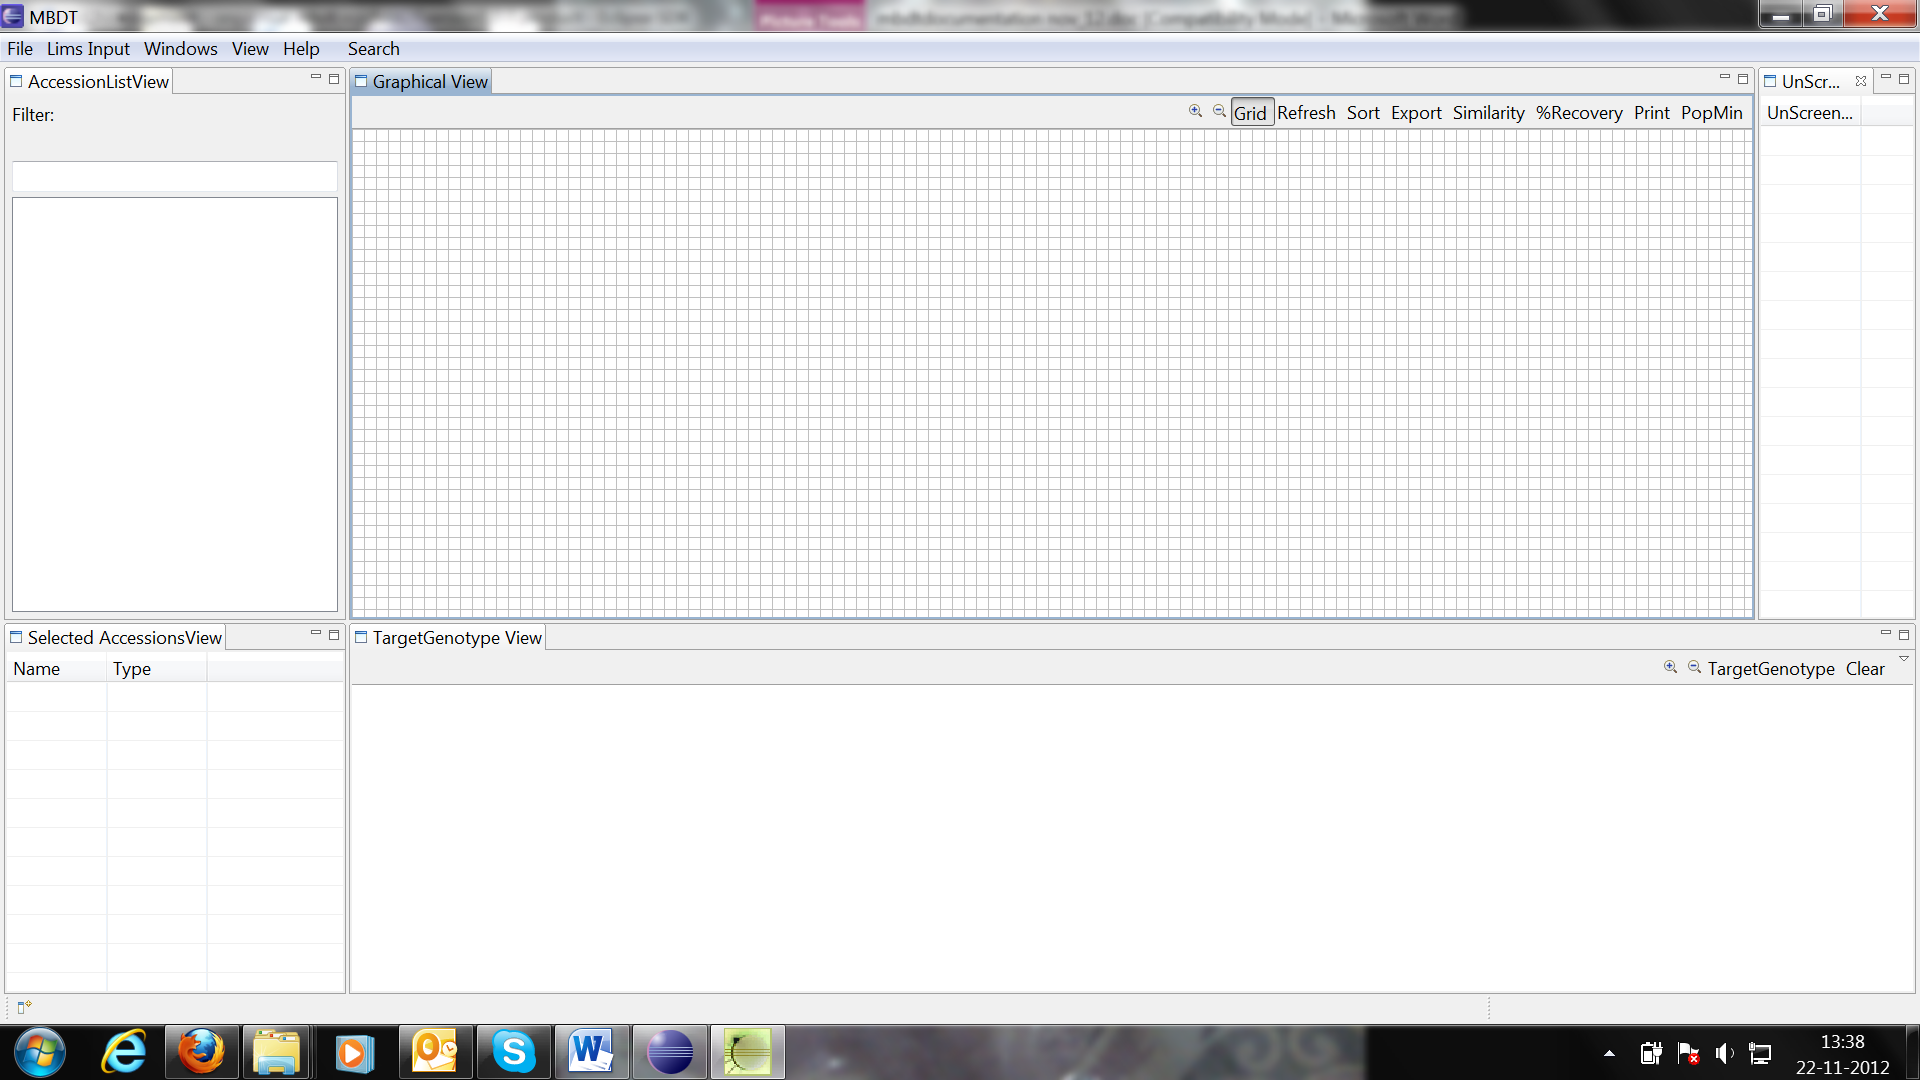
Default workbench view
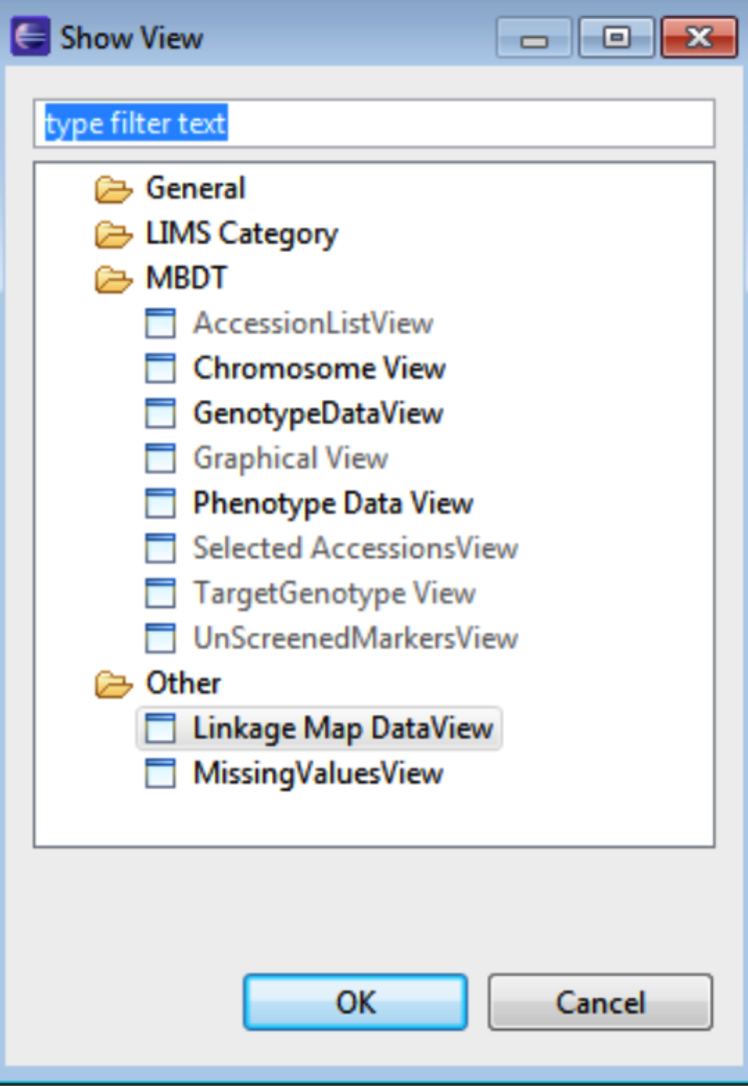
Clicking the button in the bottom left of the window displays the other tab options.
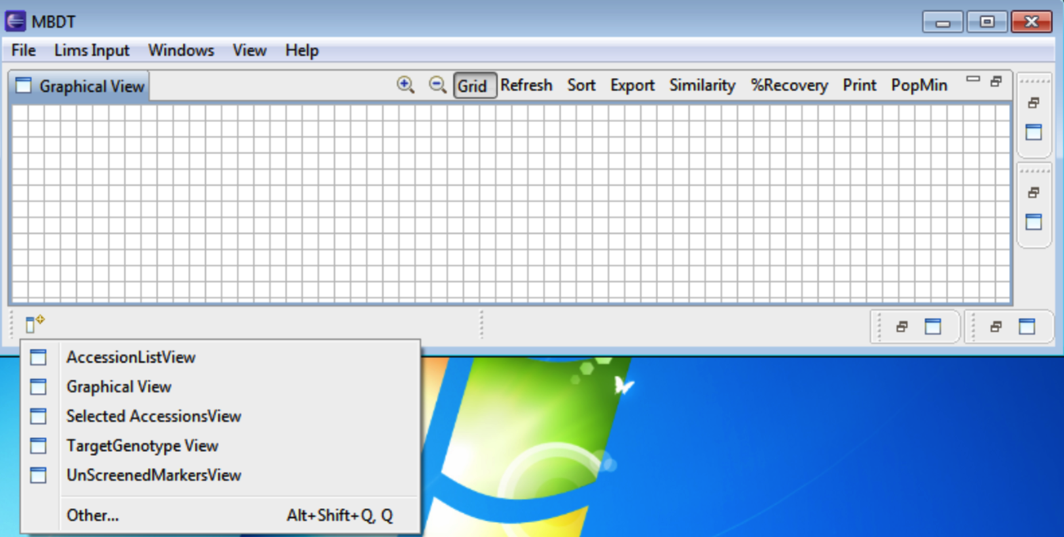
Selecting Other allows for additional windows to be selected and opened by selecting OK.
Double clicking any tab brings the window to full screen. The windows on the workbench can be dragged and dropped to customize the workbench.
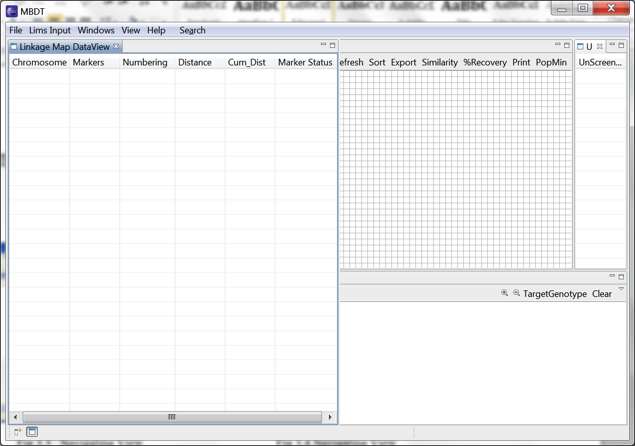 Left: Linkage Map Data View is opened in the workbench at the starting position of the workbench. Right: Linkage Map Data View repositioned in right corner of the workbench
Input Files
MBDT input files include tab delimited text files:
- Genotype data in GCP genotyping data template,
- Linkage Map data in CMTV readable file format,
- QTL information from iMAS
- Phenotype Data
Demonstration Data
Demonstration data located in:
C:Breeding Management SystemDocumentsMBDTInput FilesSample Data
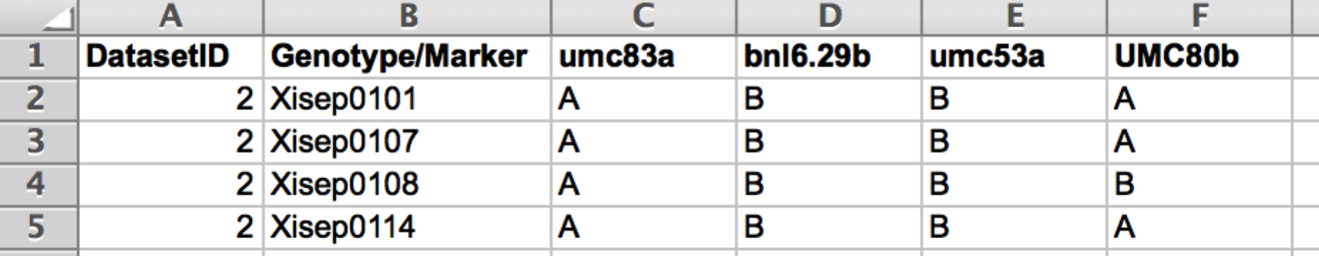
Genotype File
Prepare the genotype data file as a .txt file. When saving in Microsoft Excel select the Tabs Delimited Text option. The DatasetID column identifies the dataset. The Genotype/Marker identifies the lines or accessions. Subsequent columns contain the marker data .
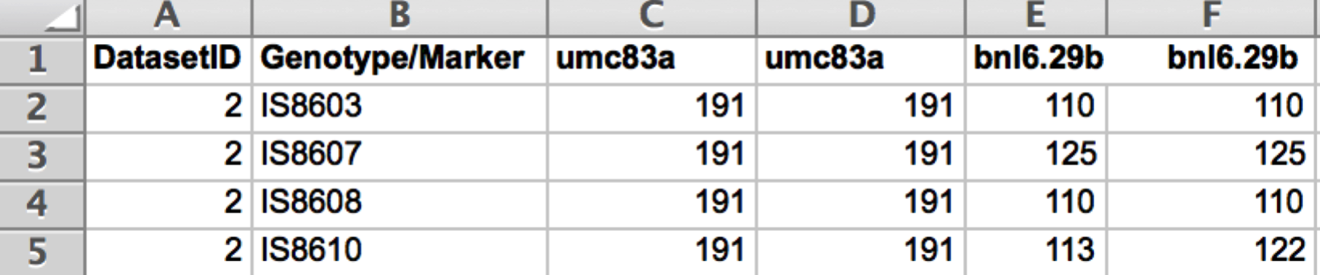
Prepare advanced generation genotype data as follows:
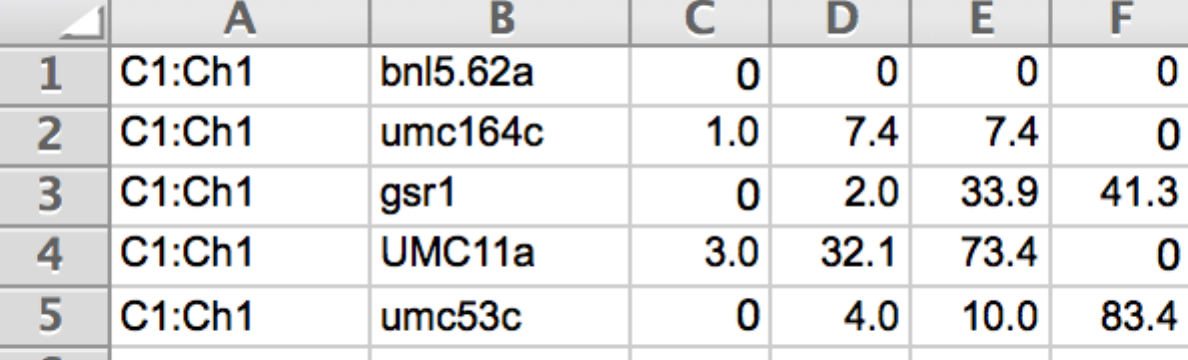
Linkage Map File
Prepare the Genotype data file as a .txt file. When saving in Microsoft Excel select the Tabs Delimited Text option. The DatasetID column identifies the dataset. The Genotype/Marker identifies the lines or accessions. Subsequent columns contain the marker data.
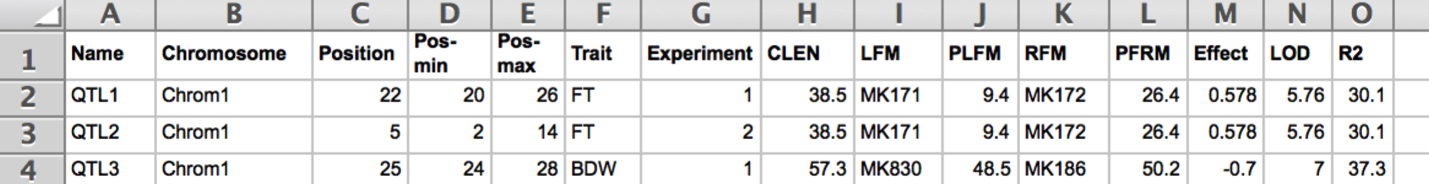
QTL File
Prepare the QTL file as a .txt file with the following column headings:
- Name: QTLID
- Chromosome: Chromosome ID
- Position: QTL position with highest LOD score (cM)
- Pos-min: Start position of the QTL (cM)
- Pos-max: End position of the QTL
- Trait: Trait ID
- Experiment: Environment ID
- CLEN: Chromosome length (cM)
- LFM: Left flanking QTLmarker
- PLFM: Position of left flanking QTLmarker
- RFM: Right flanking QTLmarker
- PRFM: Position of right flanking QTLmarker
- Effect
- LOD
- R2
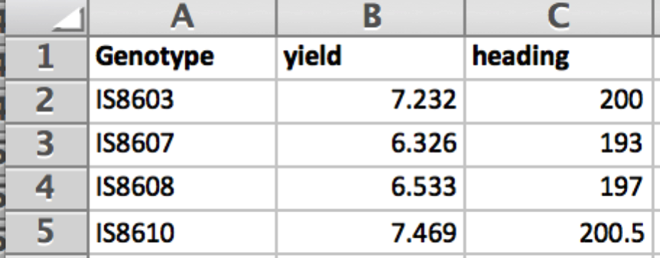
Phenotype File
Prepare the phenotype file as a .txt file with the first column heading, Genotype, identifying lines or accessions, followed by columns of trait measurements.
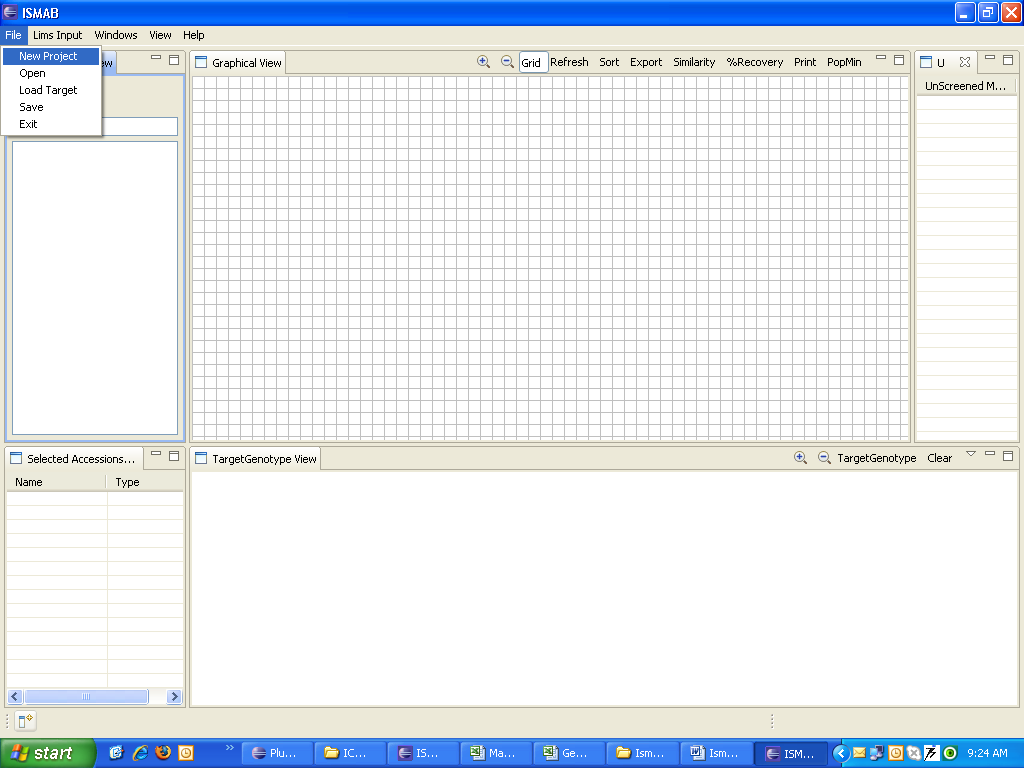
Create New Project
Select New Project action from the File menu to load data.
Browse the input files: genotype, linkage map, QTL, phenotype. Genotype and linkage map file are mandatory. Once you browse the files, the system validates the input files and prompts the summary, which includes marker type, number of genotype, markers, traits, and QTLs. The warning log will display information about missing data, duplicated markers and other relevant warnings.
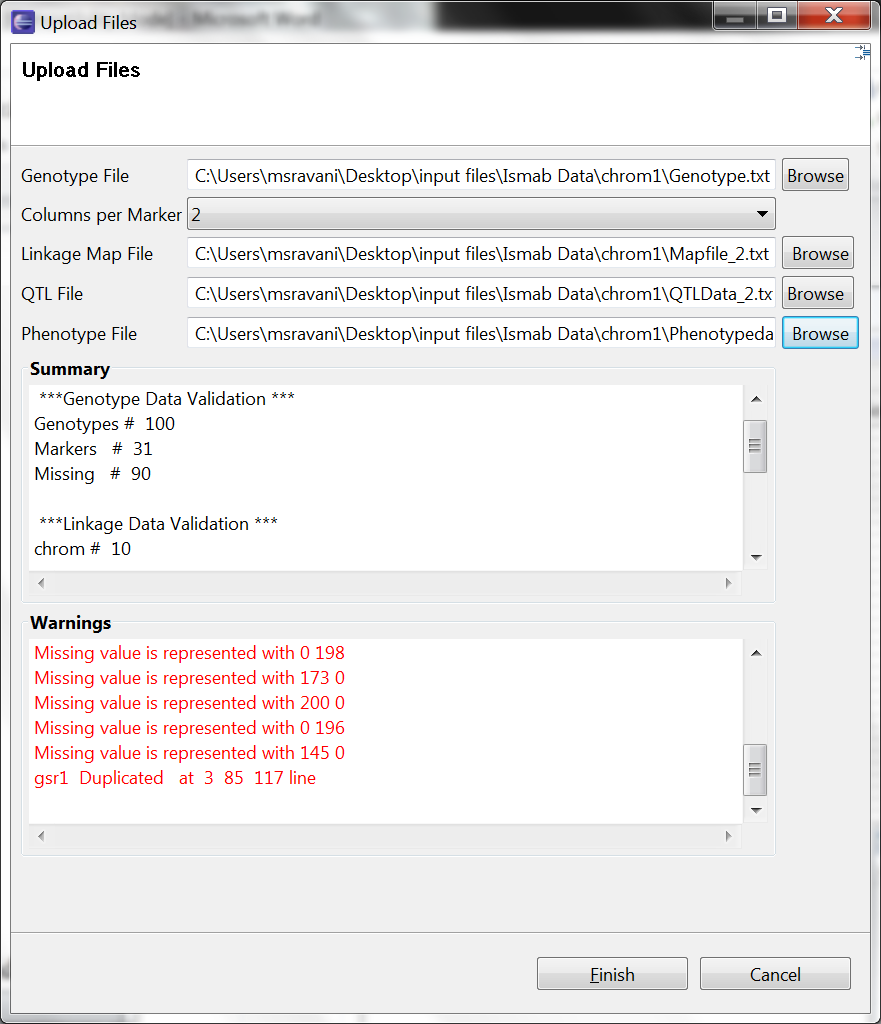
Click Finish to upload files to the workbench and observe that Graphical View overlays QTL onto the Linkage Map.
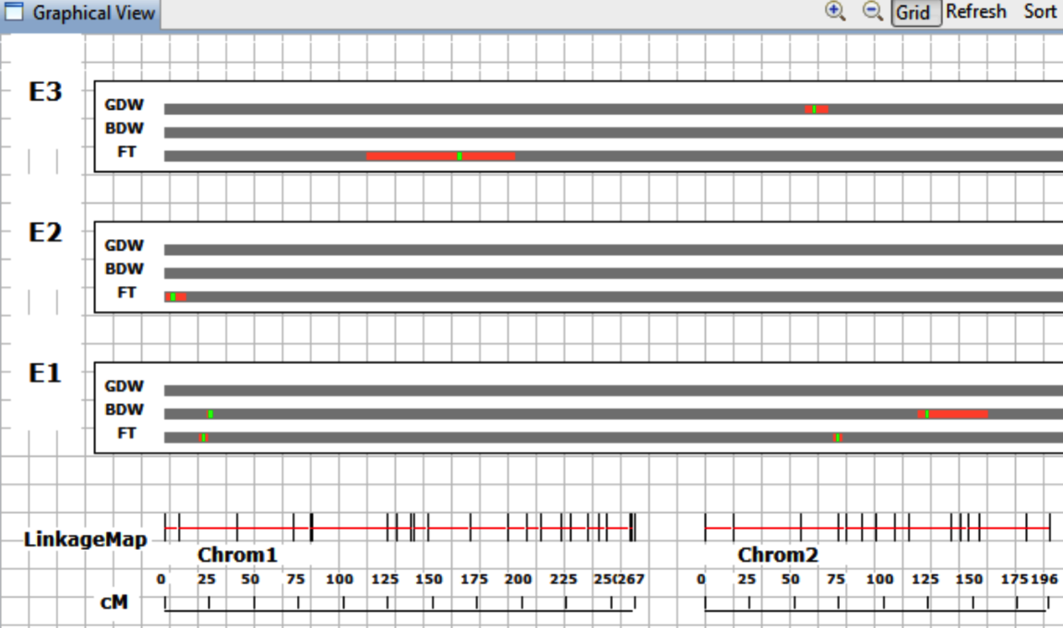
E1, E2, E3 indicates that phenotypic data was collected from three enronments.
Save Project
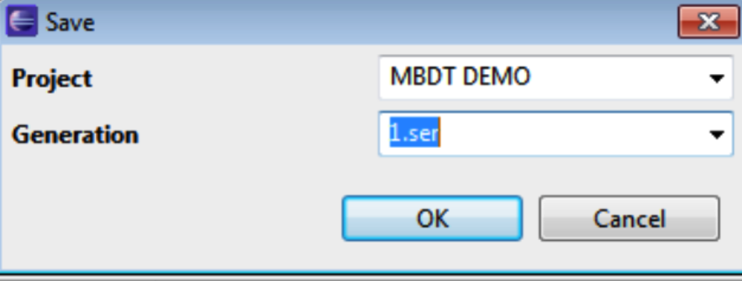
Select File>Save. Enter and project name and generation. Click OK. The project will be saved as a .ser file within a MBDT_PROJECTS files folder.
Open Project
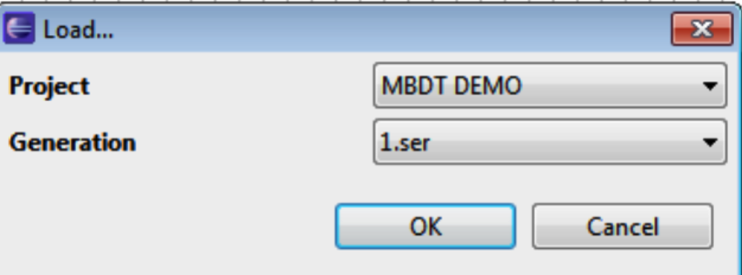
Select File>Open. Select the project name and generation. Click OK to load the project.?
 ?
?
